Kambez Saidi - Expertise
Data Analyst
Job Description & Achievements
- Extracted insights from complex datasets to guide business decisions.
- Developed automated Excel and PowerBI reports, saving 15+ hours per week.
- Performed statistical analysis to identify sales and market trends.
- Designed visualizations to present KPIs clearly to stakeholders.
- Cleaned and transformed raw data for accurate reporting.
Skills Learned
- Data visualization with PowerBI & Excel
- SQL querying and report automation
- Statistical analysis
- Data cleaning and transformation
- Stakeholder reporting
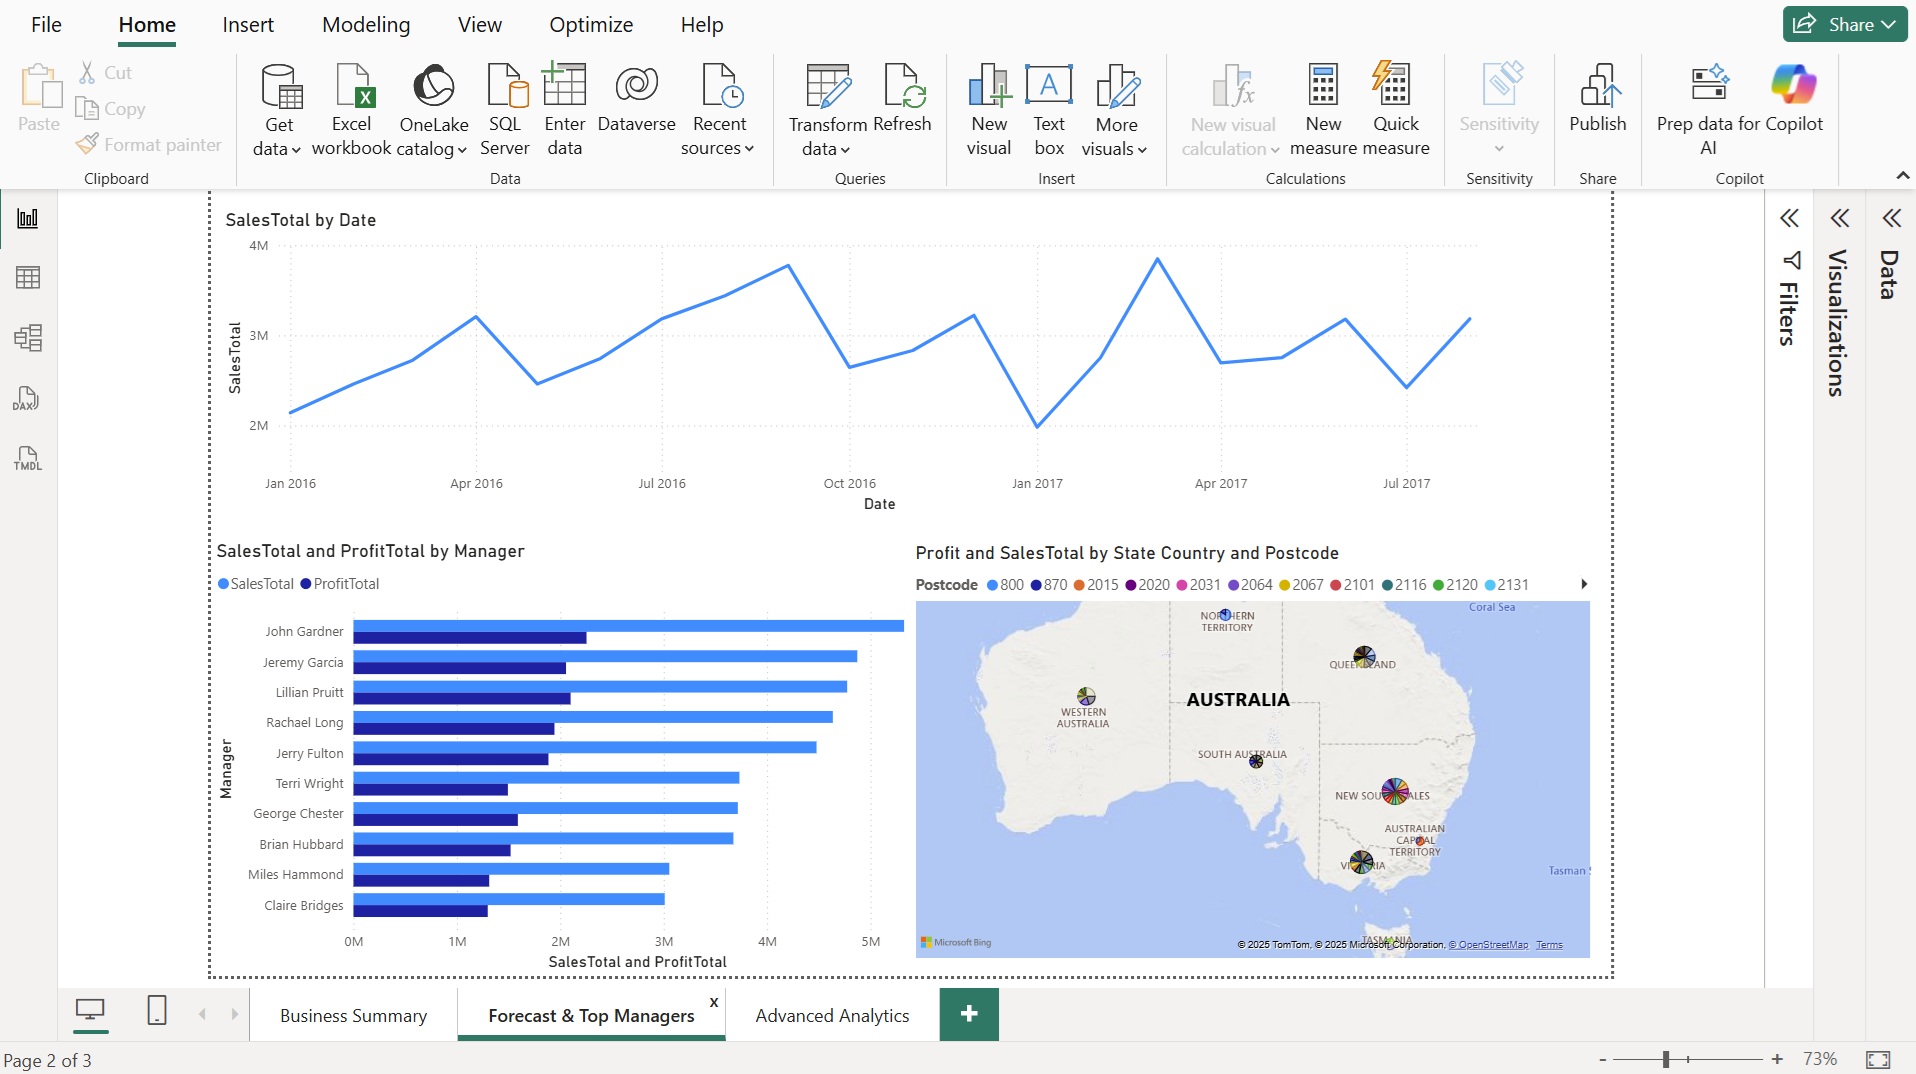
Forecast and Top Managers. The forecase shows where the most sales has been carried based on the post code. The Sales Total by date shows when the sales increases have been made and where it has dropped. This trends can be further looked at to see what had influenced the increase in sales. Top Sales made by Managers is also another area where the managers can share their success which can be a learning process for other stores.
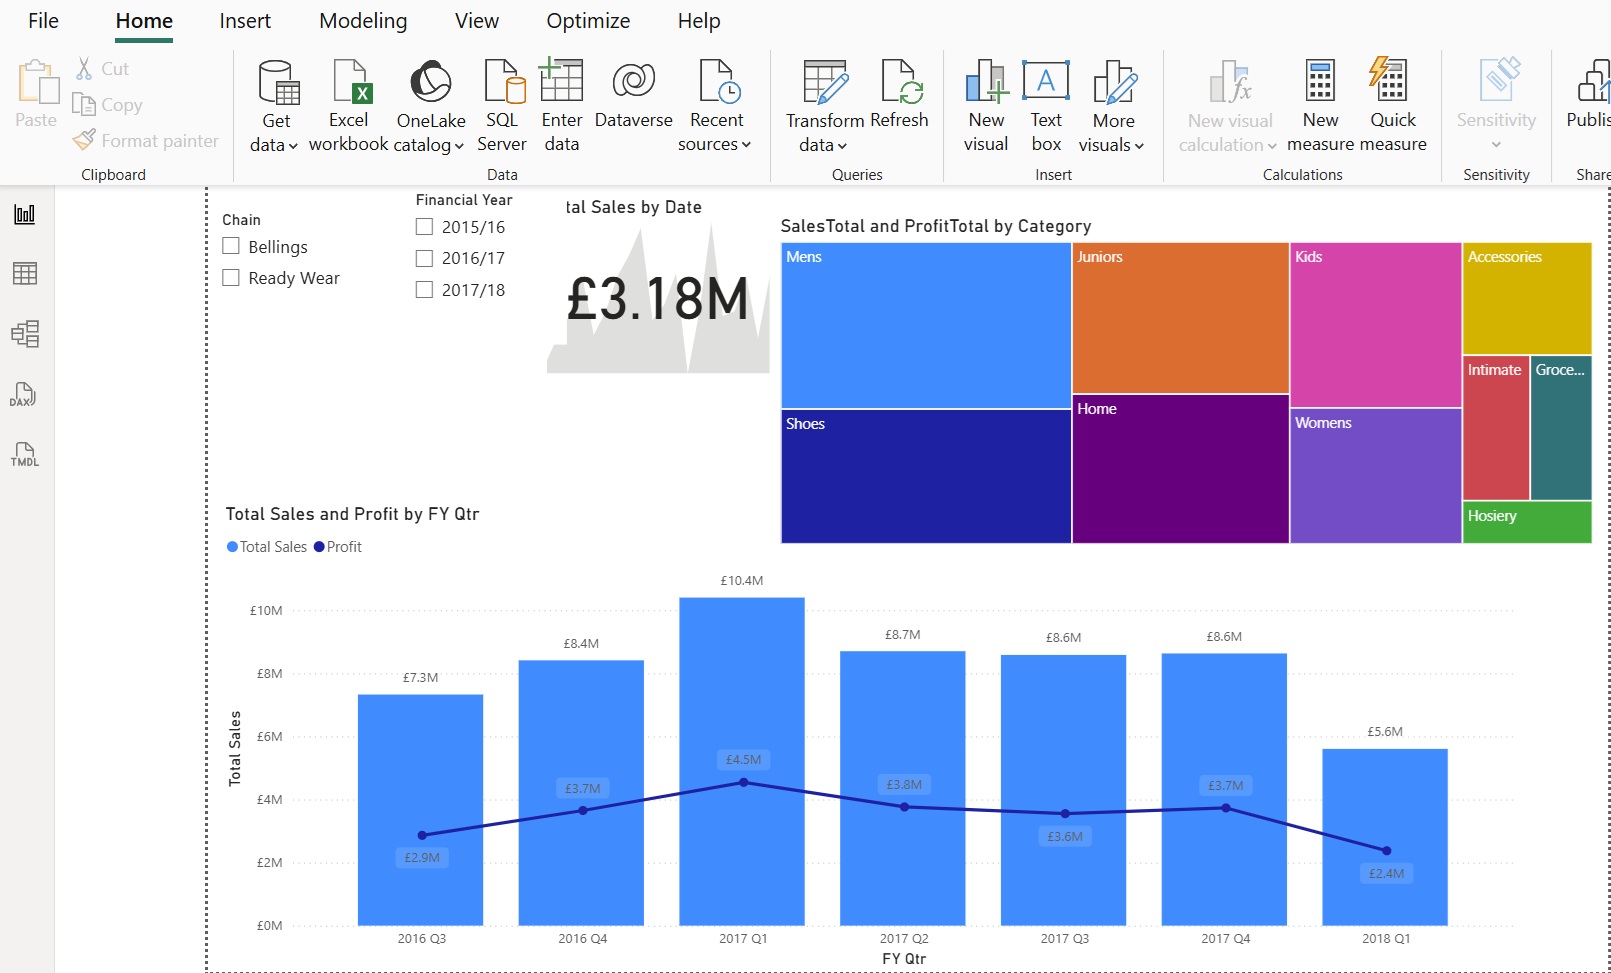
Business summary dashboard in PowerBI. Demonstrating the Anuual sales and profits, the category that the most sales were made as well as the least
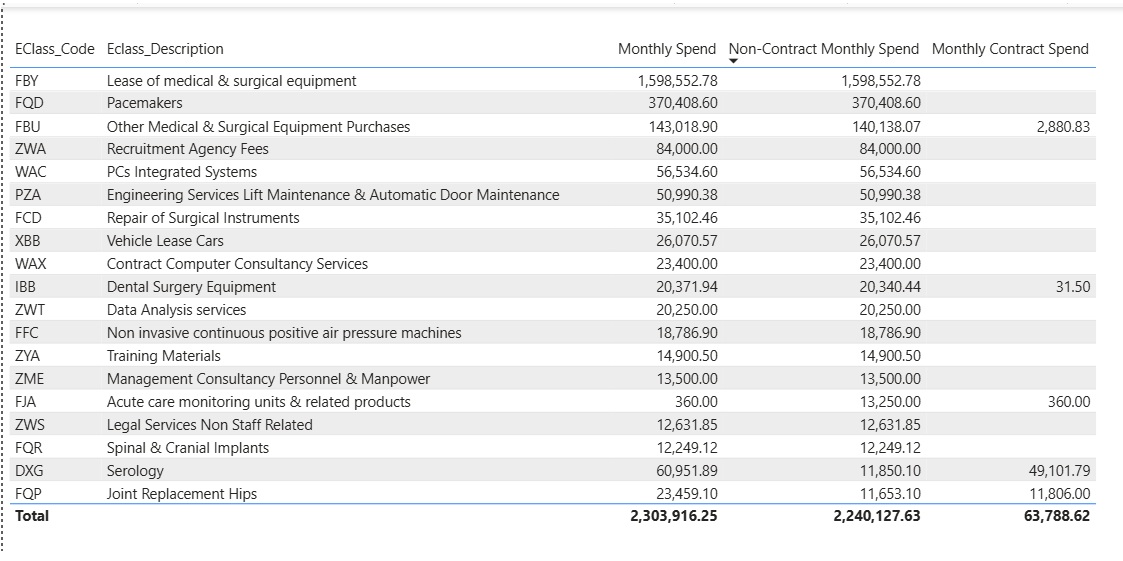
Non-contract spending analysis. Demonstrating that NHS has more non-contract spending when Contracts are available